Floods · BSc dissertation, 2023

Where is Bangladesh most likely to flood?

For my BSc dissertation I mapped how likely every part of Bangladesh is to flood. I built a national flood inventory from 1970 to 2022, mapped ten conditioning factors, and combined them with GIS-based multi-criteria analysis.

Floods

Ten factors that shape flooding

Each map is one flood conditioning factor, reclassified and weighted with the Analytic Hierarchy Process (AHP). Wetness and distance from the major rivers carried the most weight.
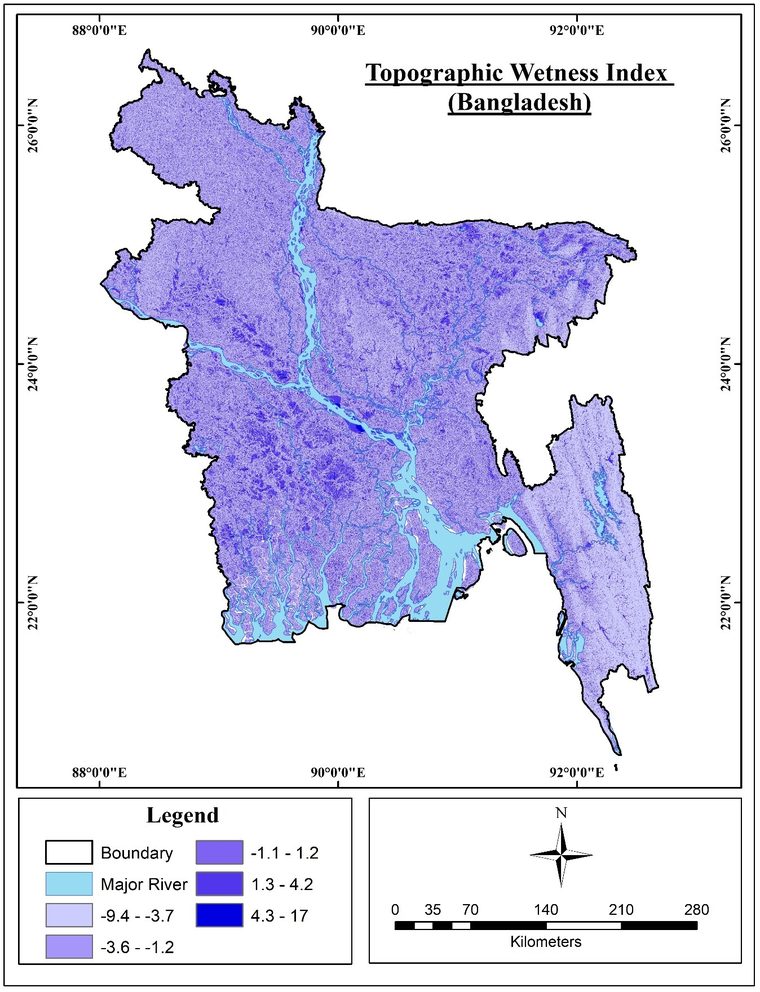
Map of Topographic Wetness Index across Bangladesh
Topographic Wetness Index: where water tends to collect.
0.14
AHP weight of this factor
  • Wetness0.14
  • River distance0.14
  • Rainfall0.13
  • Elevation0.12
  • Slope0.10
  • Drainage0.09
  • Soil0.09
  • Land cover0.07
  • NDVI0.06
  • Road distance0.06

The result

Combining the weighted layers gave a flood susceptibility map for the whole country. More than half of Bangladesh falls in the high or very high classes. Checked against the national flood inventory, the map scored an AUC of 0.815.
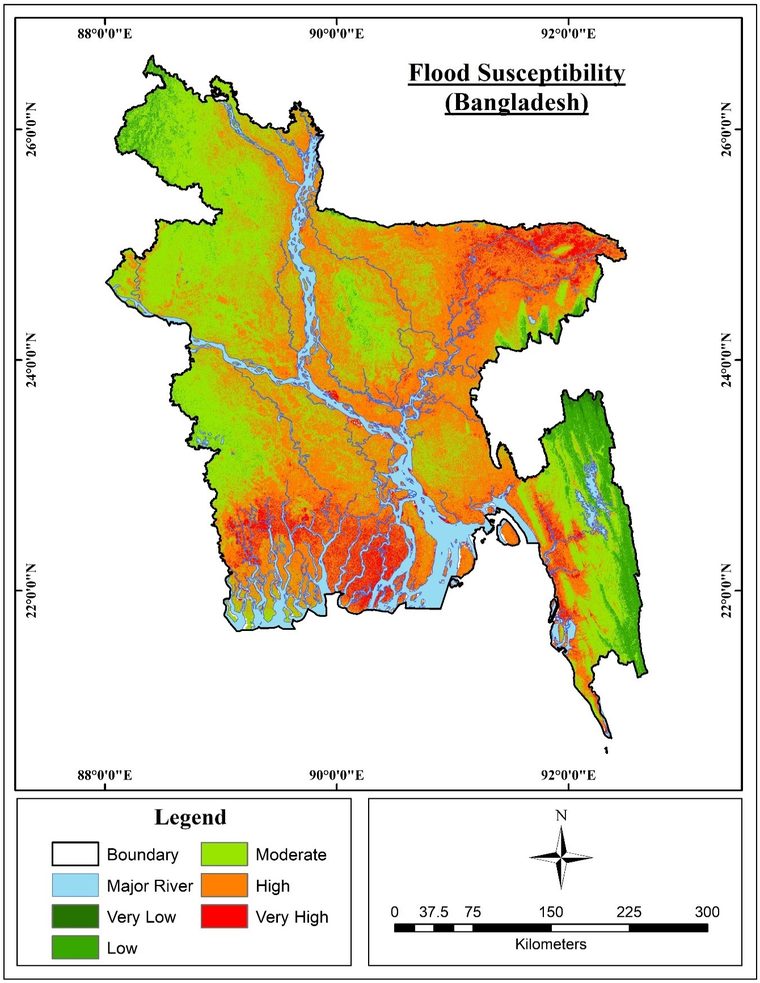
Flood susceptibility map of Bangladesh in five classes from very low to very high
Flood susceptibility map of Bangladesh, from very low (dark green) to very high (red).
0.815
AUC from ROC validation
Share of the country in each class
  • Very high7.9%
  • High48.7%
  • Moderate37.75%
  • Low5.45%
  • Very low0.2%

Maps from my BSc dissertation, Jahangirnagar University, 2023. Supervisor: Prof. Dr. Khandakar Hasan Mahmud.

What came next

I am now extending this work to test how well expert-based, statistical and machine learning models transfer to regions they were not trained on. That study is under review at Natural Hazards and Earth System Sciences.

Get in touch

Open to research collaborations, graduate positions and GIS consultancy.

LinkedInResearchGateFacebook