Using Landsat 8 imagery from before and after each storm, I mapped how the coastline of Bangladesh moved after cyclones Sitrang, Bulbul, Amphan and Mocha. Stronger storms caused more erosion. Satkhira and Khulna lost the most shoreline, Bhola and Noakhali gained land through accretion, and Cox's Bazar held up comparatively well.
Coasts
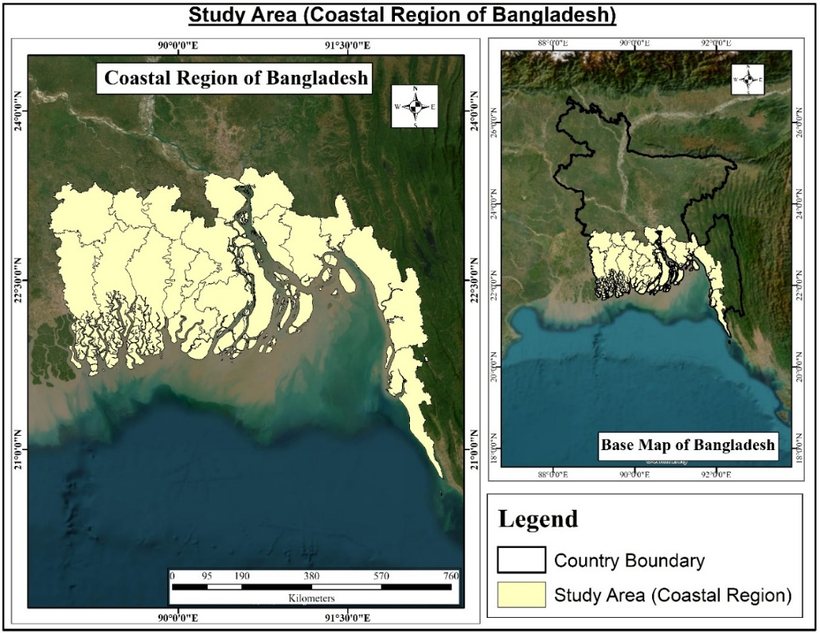
Study area: the coastal districts of Bangladesh.
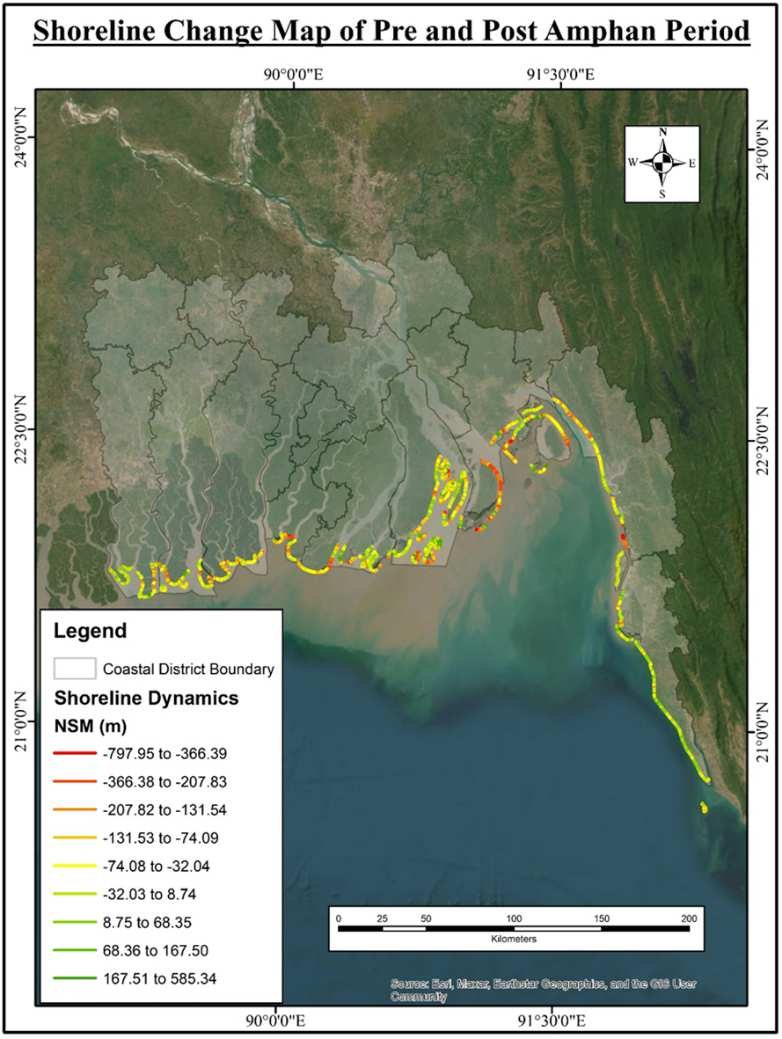
Shorelines were extracted with the MNDWI water index and compared with the Digital Shoreline Analysis System (DSAS), which measures net shoreline movement along transects in metres.
Choose a cyclone below to see its shoreline change map.
Net shoreline movement (m), before and after Cyclone Amphan.
77.67%
of the measured shoreline eroded
The strongest storm in the study, with winds of about 150 mph, caused the most severe erosion.
Sitrang52.72%
Bulbul57.39%
Amphan77.67%
Mocha77.36%
How shoreline change is measured
shoreline beforeshoreline after, shaded where land was lostDSAS transects
Landsat 8 scenes before and after each landfall
MNDWI separates water from land
Shoreline extracted for each date
DSAS transects measure erosion and accretion
Coastal districts zoned by impact
Schematic illustration of the method, not measured data.
Maps from Pobon, Akter & Mahmud, preprint on Research Square, CC BY 4.0.
From the MSc thesis
What the cyclones did to vegetation
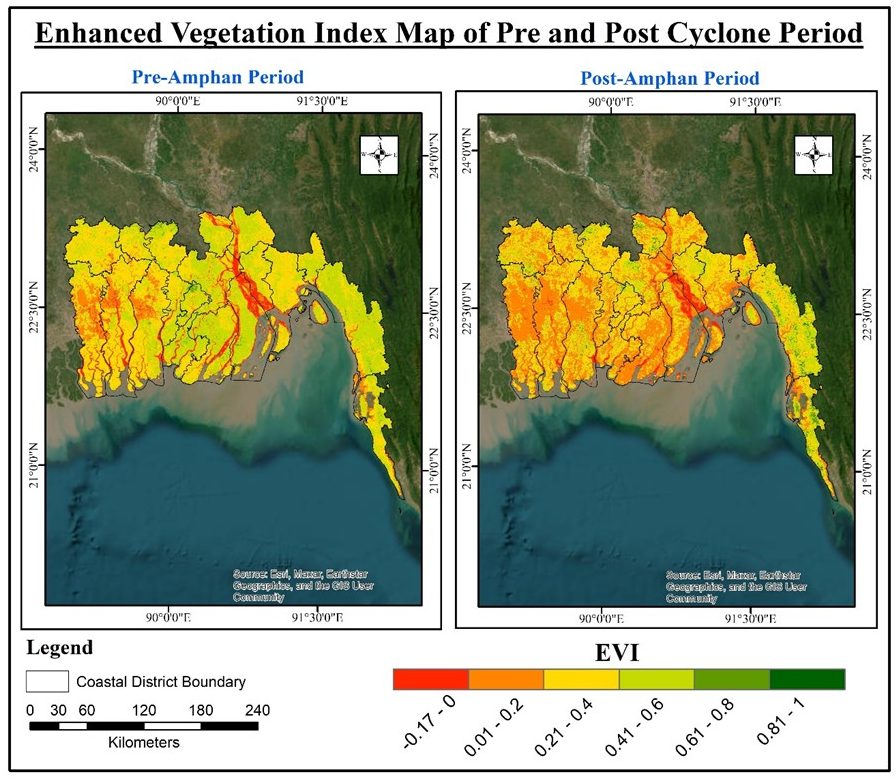
The thesis also measured vegetation health before and after each storm with the Enhanced Vegetation Index (EVI) from MODIS. The weaker storms barely changed it. Amphan stripped healthy vegetation from a quarter of the coastal region.
EVI before and after Cyclone Amphan. Red and orange show sparse or stressed vegetation, green shows healthy cover.
−26.1
percentage points of healthy vegetation lost
Healthy cover fell from 84.1% to 58.0% of the region, while moderate vegetation rose by 24 points.
Sitrang−2.89
Bulbul−2.16
Amphan−26.1
Mocha−2.68
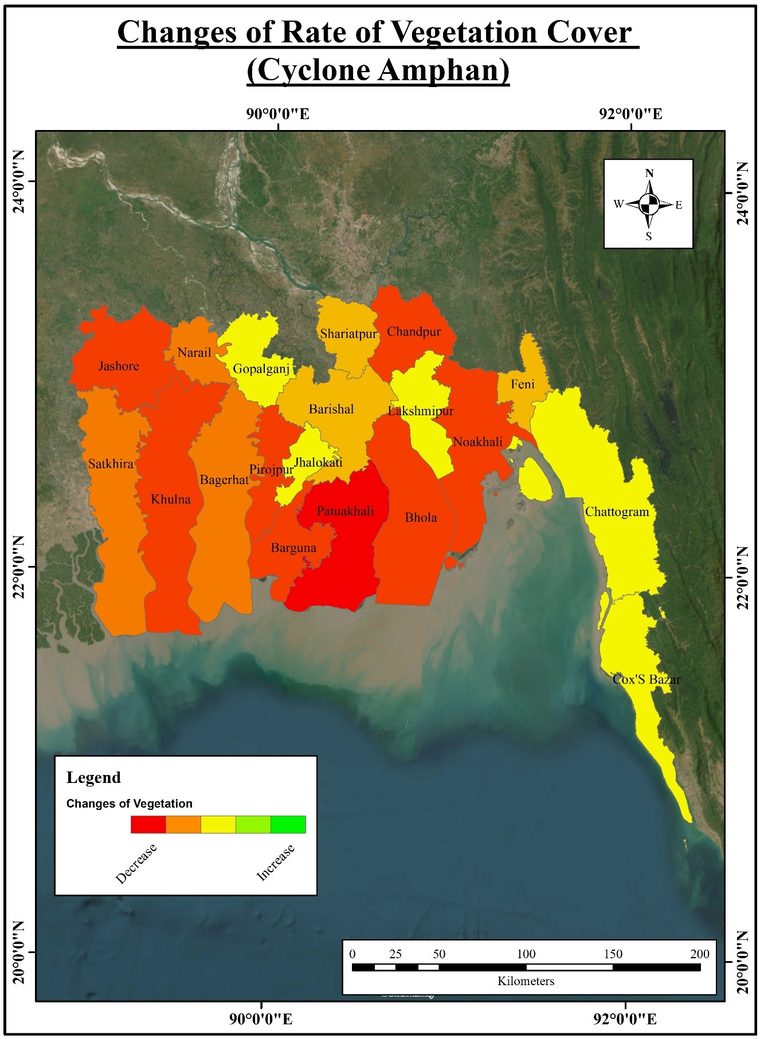
Change in vegetation cover by district after Cyclone Amphan.
Healthy vegetation lost after Amphan
Patuakhali−50.9
Barguna−37.8
Pirojpur−34.1
Khulna−29.1
Jashore−27.9
Percentage points of each district's vegetated area that dropped out of the healthy class.
Maps from my MSc thesis, Jahangirnagar University, 2024.
Pobon, M. T. A. N., Akter, R., and Mahmud, K. H. Submitted to The Jahangirnagar Review. Preprint on Research Square, November 2025 · doi:10.21203/rs.3.rs-7954742/v1
MSc thesis
Geo-spatial Technology for Rapid Eco-Physical Impact Assessment of Tropical Cyclones of the Bay of Bengal
Measured the physical impact of multiple cyclones with multi-temporal GIS and remote sensing, using shoreline erosion and deposition as the main indicator alongside vegetation change.
Quantified shoreline change for four cyclones (Sitrang, Bulbul, Amphan and Mocha) using Landsat 8 imagery, MNDWI and the Digital Shoreline Analysis System (DSAS).
Compared impacts across cyclone categories to gauge relative severity.
Zoned coastal districts by impact, giving a spatial framework for risk management.